Dollar-Cost Averaging Calculator: See Your Actual Returns
DCA Is Simple. Knowing Whether It's Working Is Not.
Dollar-cost averaging — investing a fixed amount on a fixed schedule regardless of price — is one of the most widely recommended investment strategies. It removes the timing decision, reduces the impact of volatility, and keeps you investing consistently through market cycles. Most people who invest in index funds are already doing it, whether they know it or not.
What most people don't know: their actual average cost basis, their real return vs. lump sum, and whether their DCA schedule is optimized for their situation.
Lump Sum vs. DCA: What the Data Actually Says
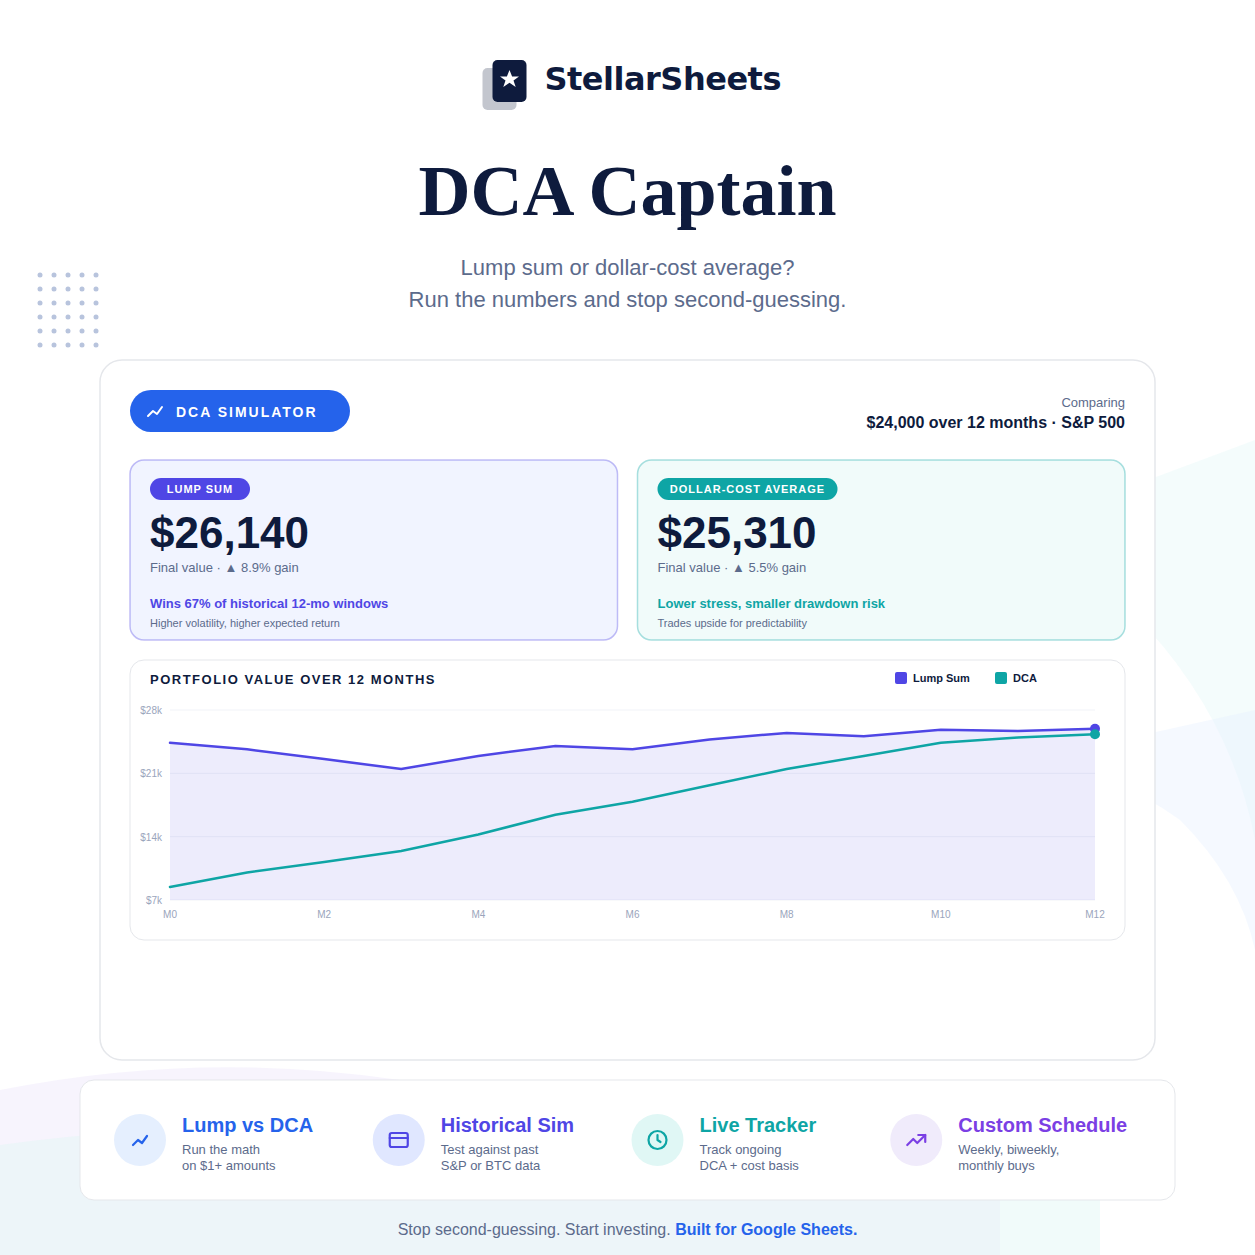
Lump sum investing outperforms dollar-cost averaging approximately two-thirds of the time historically. The reason is simple: markets trend upward over time, so deploying capital earlier captures more of that growth.
But that statistic doesn't tell the whole story. The one-third of the time lump sum underperforms — when you invest right before a significant downturn — can be psychologically and financially devastating. A 30% drop on a $100,000 lump sum investment in month one is a $30,000 loss. The same $100,000 deployed over 12 months at $8,333/month would have a much lower average cost basis after that same downturn.
The right choice depends on your risk tolerance, your timeline, and the specific asset you're investing in. DCA into a volatile asset (crypto, individual stocks) provides more downside protection than DCA into a broad index fund. Lump sum into a broad index fund over a long horizon has historically been the higher-return choice.
How to Calculate Your Average Cost Basis
Average cost basis = total amount invested ÷ total shares/units purchased.
If you bought 10 shares at $100, 10 shares at $80, and 10 shares at $120:
- Total invested: $3,000
- Total shares: 30
- Average cost basis: $100/share
Your gain or loss is calculated against this average, not against any individual purchase price. This matters for taxes — when you sell, your taxable gain is the sale price minus your average cost basis (using the average cost method).
DCA and Your FIRE Timeline
DCA is the default investment strategy for most FIRE pursuers — invest a fixed percentage of every paycheck into index funds, regardless of market conditions. The consistency is the point. Over a 15–25 year FIRE timeline, the difference between DCA and lump sum is small compared to the difference between investing consistently and not investing at all.
For context on how DCA contributions compound toward your FIRE number, see How to Calculate Your FIRE Number and Actually Hit It.
The DCA Schedule That Actually Matters
Weekly, biweekly, or monthly — the frequency matters less than the consistency. What does matter:
- Align with your pay schedule — invest on payday before the money has a chance to be spent
- Automate it — manual investing requires a decision every period; automation removes the decision and the temptation to skip
- Don't stop during downturns — this is when DCA works best; you're buying more shares at lower prices
- Increase contributions when possible — even $50/month more compounds significantly over a decade
Tracking Your DCA Progress
Log every purchase: date, amount invested, price per share, shares purchased. Your tracker should show: total invested to date, total shares owned, average cost basis, current value, and unrealized gain or loss. Update it monthly. Watching your average cost basis and current value diverge over time is one of the most motivating things in personal finance.
For a broader investment tracking system that includes DCA alongside your full portfolio, see Portfolio Tracker Google Sheets: Track Stocks, ETFs, and Crypto in One Place.
Frequently Asked Questions
What is dollar-cost averaging?
Dollar-cost averaging (DCA) is an investment strategy where you invest a fixed dollar amount on a fixed schedule — weekly, biweekly, or monthly — regardless of the asset's current price. When prices are low, your fixed amount buys more shares. When prices are high, it buys fewer. Over time, this produces an average cost basis that's lower than the average price.
Is dollar-cost averaging better than lump sum investing?
Lump sum investing outperforms DCA approximately two-thirds of the time historically, because markets trend upward and earlier deployment captures more growth. DCA outperforms in the one-third of scenarios where markets decline after the investment date. For most people with regular income (not a windfall), DCA is the natural approach — you invest what you have when you have it.
How do I calculate my average cost basis for DCA?
Divide your total amount invested by the total number of shares purchased across all purchases. Example: $5,000 invested across 5 purchases of varying prices that resulted in 47 total shares = $106.38 average cost basis per share.
Should I stop DCA during a market downturn?
No — downturns are when DCA works best. You're buying more shares at lower prices, which lowers your average cost basis. Stopping during downturns is the most common DCA mistake and eliminates the primary benefit of the strategy.
How does DCA affect my taxes?
Each DCA purchase creates a separate tax lot with its own cost basis and holding period. When you sell, you can choose which lots to sell (specific identification method) to optimize your tax outcome — selling lots held over a year qualifies for long-term capital gains rates. A tracker that logs every purchase date and price makes this optimization possible.
Ready to Put This Into Action?
The math behind freedom is simple. The DCA Captain – Dollar-Cost Averaging Calculator compares lump sum vs. DCA, tracks your contributions and average cost basis, and stress-tests your strategy against historical market data. Pre-built formulas, instant download, yours forever.
Or browse the full Savings & Investing Templates collection to find the right tool for your situation.
-
Posted in
calculator, DCA, dollar-cost averaging, google sheets, investing