How to Tell If a Rental Property Will Actually Make You Money
The Napkin Math That Gets Landlords Into Trouble
Rent minus mortgage equals cash flow. It's the calculation most new real estate investors make. It's also the calculation that leads to properties that bleed money every month. The napkin math ignores vacancy, CapEx, property management, maintenance, taxes, and insurance — the expenses that routinely turn paper-positive deals into real-world negatives.
Here's how to tell if a rental property will actually make you money before you buy it.
The 50% Rule: Your First Filter
A rough but useful heuristic: operating expenses (excluding mortgage) typically equal 50% of gross rent. If a property rents for $2,000/month, budget $1,000/month for expenses before the mortgage. What's left after the mortgage is your real cash flow.
If the 50% rule leaves you with negative cash flow, the deal probably doesn't work at that price. If it leaves you with positive cash flow, it's worth deeper analysis.
The 1% Rule: Your Second Filter
Monthly rent should be at least 1% of the purchase price. A $200,000 property should rent for $2,000+/month. Properties that pass the 1% rule are more likely to cash flow after real expenses. Properties that fail it require exceptional appreciation or other factors to justify the investment.
In expensive markets, the 1% rule is nearly impossible to hit. That's useful information — it tells you the market is priced for appreciation, not cash flow.
The 5 Expenses Most Investors Underestimate
Vacancy — even great properties sit empty between tenants. Budget 5–8% of gross rent. On $2,000/month, that's $100–$160/month you should never count on.
CapEx reserves — roof, HVAC, water heater, appliances are inevitable. Budget 5–10% of gross rent monthly. Ignore this and one repair wipes out a year of cash flow.
Property management — 8–12% of collected rent. Model it even if self-managing. If you ever want to scale, travel, or stop being a landlord 24/7, you'll pay this.
Maintenance — 1–2% of property value annually. On a $250,000 property: $2,500–$5,000/year.
Insurance and taxes — always get actual quotes. National averages are useless for underwriting a specific deal.
The Metrics That Actually Tell You If It's a Good Deal
Cash-on-cash return — annual cash flow ÷ total cash invested. 6%+ is solid. Below 4% warrants scrutiny unless you have strong appreciation thesis.
Cap rate — NOI ÷ property value. Financing-independent view of performance. Useful for comparing deals across different financing structures.
Debt service coverage ratio (DSCR) — NOI ÷ annual debt service. Above 1.25 means the property generates 25% more income than needed to cover the mortgage. Below 1.0 means it doesn't cover its own debt.
The Stress Test
Before making any offer: what happens if rent drops 10%? Vacancy hits 15%? A major repair hits in year one? If the deal only works under perfect conditions, it's not a deal — it's a bet.
Ready to Put This Into Action?
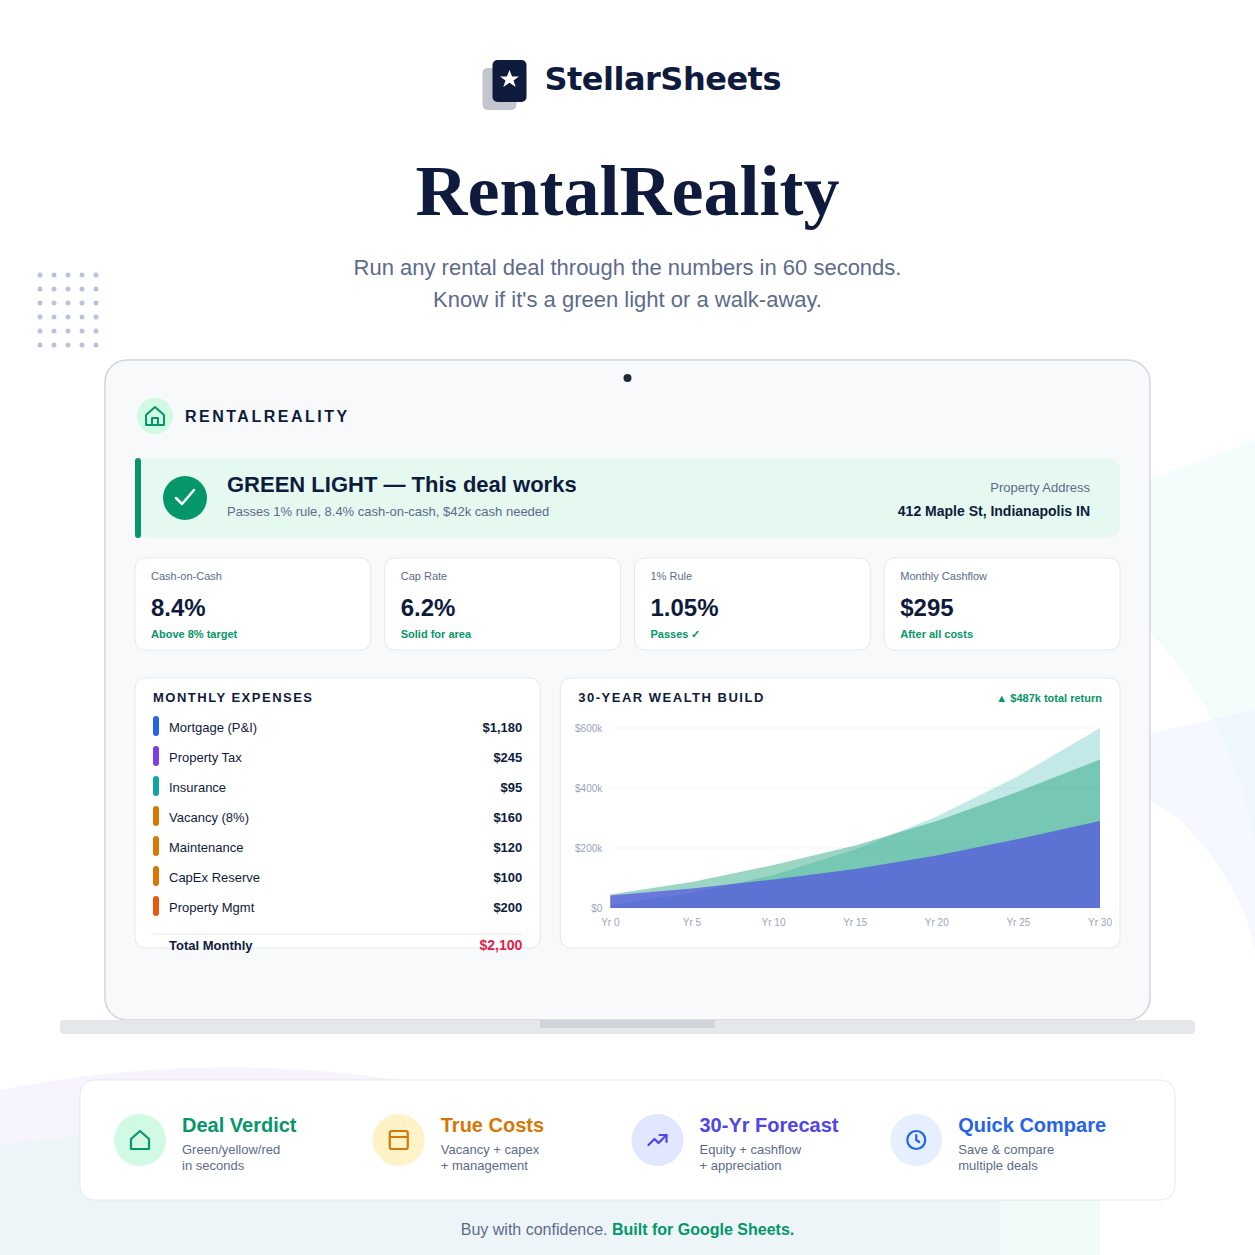
The math behind freedom is simple. The RentalReality – Rental Property Analyzer calculates cap rate, cash-on-cash return, and 30-year projection instantly — with what-if modeling built in. Pre-built formulas, instant download, yours forever.
Or browse the full Savings & Investing Templates collection to find the right tool for your situation.